627 Tennyson Avenue, Palo Alto
Luxurious 6-bedroom home built in 2015 in the heart of Old Palo Alto. Click here for details. $9,850,000
627 Tennyson Avenue, Palo Alto
Luxurious 6-bedroom home built in 2015 in the heart of Old Palo Alto. Click here for details. $9,850,000
70 Stonegate Road, Portola Valley
Remodeled and expanded country retreat with tennis court on approximately 1.3 acres. Click here for details. $5,995,000
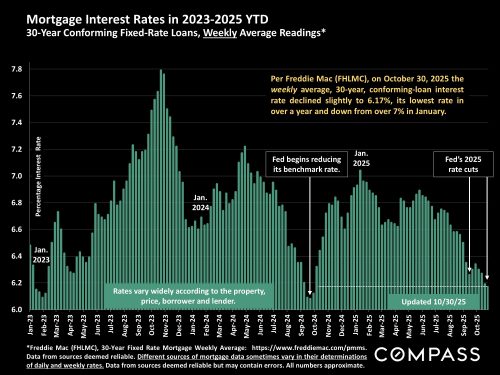
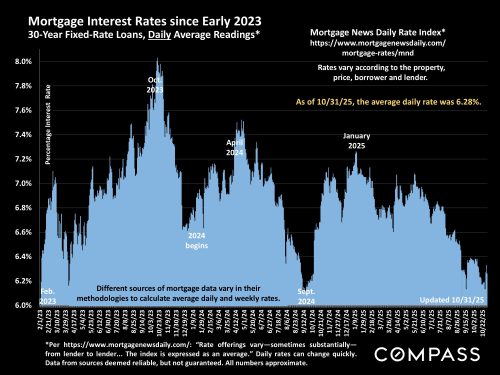
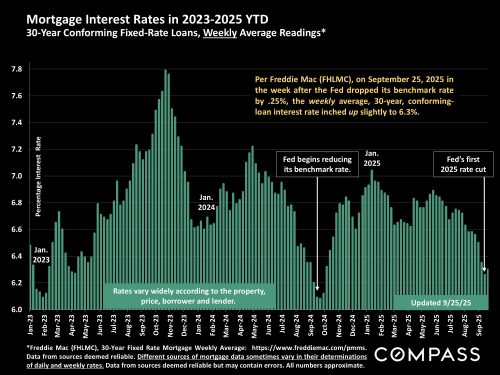
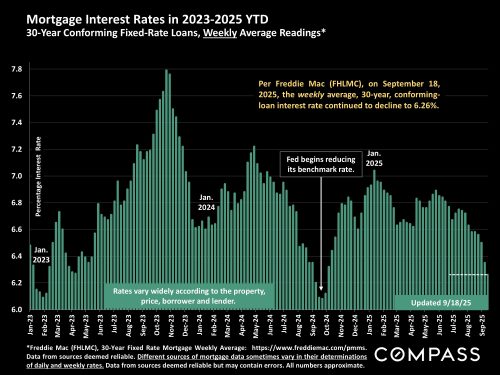
Interest rates ticked up after the Fed’s .25% benchmark rate cut: Freddie Mac’s weekly average rate – for 30-year conforming loans only – published yesterday, rose very slightly. The daily average rate from Mortgage News Daily (second chart below), which includes 30-year loans other than conforming, has risen .25% to 6.38% as of today.
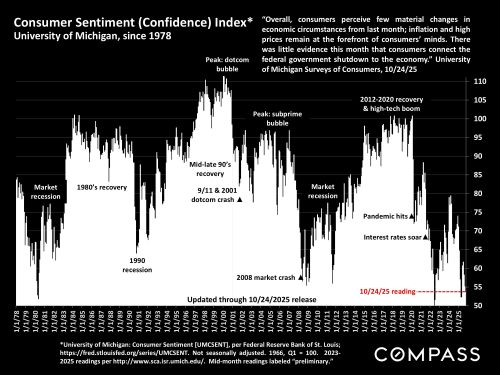
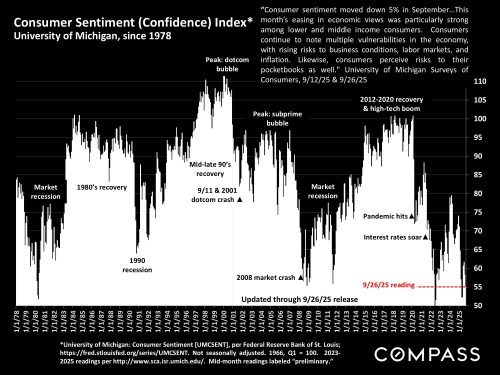
Consumer Sentiment (Confidence) continued to decline and is running very low by historical norms: “Although September’s decline was relatively modest, it was still seen across a broad swath of the population, across groups by age, income, and education, and all five index components. A key exception: sentiment for consumers with larger stock holdings held steady in September…Nationally, not only did macroeconomic expectations fall, particularly for labor markets and business conditions, but personal expectations did as well, with a softening outlook for their own incomes and personal finances.” University of Michigan Surveys of Consumers, 9/26/25
Clearly a large segment of the population remains very concerned about economic and political conditions, though the affluent – who play an enormous role in many of our markets – seem to be least affected.
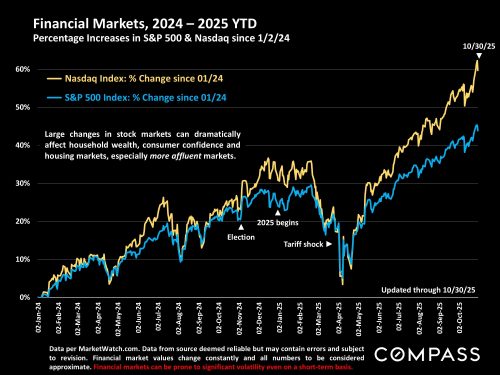
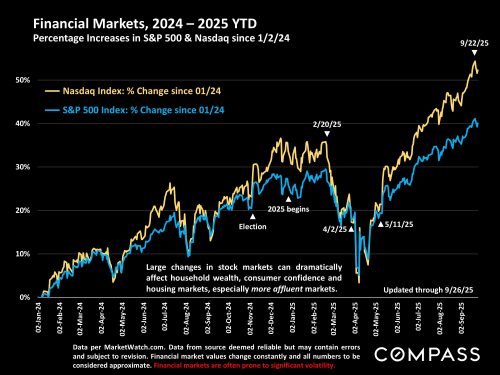
Amid the usual ups and downs, stock markets have generally continued to be exuberant – which explains the line regarding those with large stock holdings mentioned in the Consumer Sentiment quote above (which I underlined).
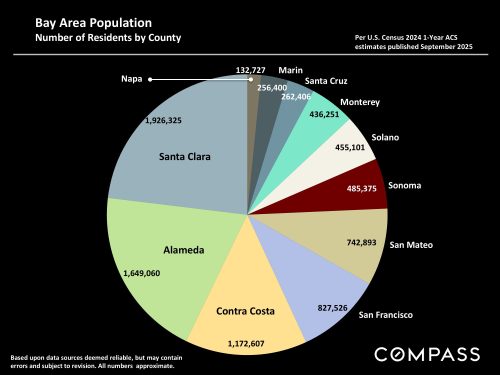
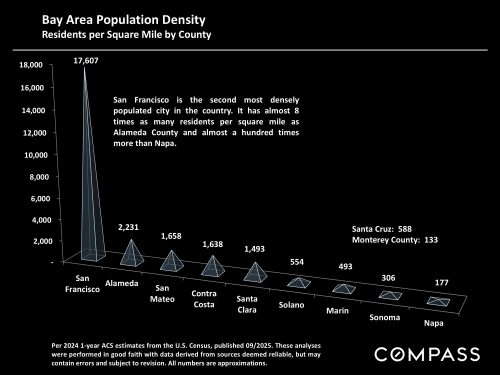
And below are some updated comparative Bay Area demographics charts from newly published Census data:
County sizes in the greater Bay Area range from 47 square miles to 3281 square miles.
Recent policy changes regarding immigration and H-1b visas may (or may not) have significant effects on the Bay Area. These policies can change dramatically by the day, so it’s hard to assess possible impacts. Clearly, the foreign-born have played a huge role in the Bay Area economy and its housing markets.
Some Bay Area counties are among the best educated in the country. Marin has the highest percentage of residents in CA with either Bachelor’s or graduate/professional degrees, and SF ranks second. Santa Clara has the highest percentage in CA of residents holding advanced degrees.
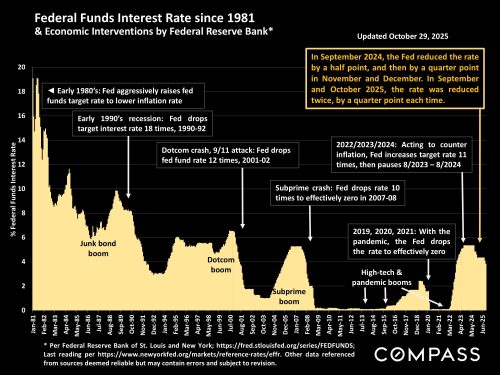
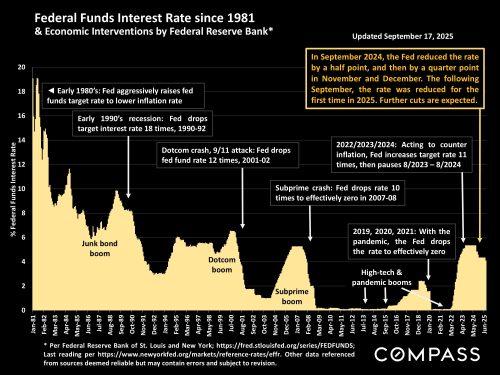
The Fed cut its benchmark rate by .25% yesterday and more cuts are currently expected by the end of the year, though much depends on future jobs and inflation data.
The weekly average 30-year rate published by Freddie Mac today declined again, but the daily average rate published by Mortgage News Daily has risen .24% since the rate cut was announced. Last year in September 2024, when the Fed first cut its benchmark rate since 2022, mortgage rates also increased (dramatically). See charts below. But it’s far too soon to predict how this will all play out in coming weeks and months.
WEEKLY average rate, published today 9/18/25:
DAILY average rate published today:
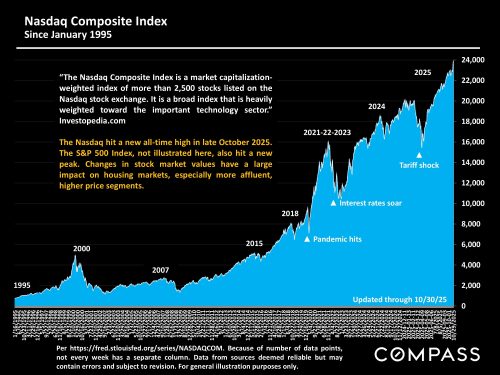
Stock markets continue to hit new highs.
An updated BAY AREA MARKET SEASONALITY pdf report as well as individual chart images illustrating broad seasonal effects on supply, demand and median sales prices are in this folder.
The SEASONALITY flipbook is posted here.
You can always find a selection of seasonality charts specific to your regional market in the monthly Bay Area newsletters, such as those included in the September reports.
Below are 5 of the 10 charts in the MARKET SEASONALITY report:
A year-over-year look at total 1st half sales for 11 greater Bay Area Counties. In Q1 2025, both dollar volume and unit sales volume increased from Q1 2024. Then in Q2, with the enormous economic volatility, dollar-volume and unit sales volume declined year over year, though not by huge percentages (down 2.5% in dollars, 3.4% in units). Overall, 1st half sales in 2025 increased about 2.4% by dollar volume sales. Note that, as always, trends varied by county.
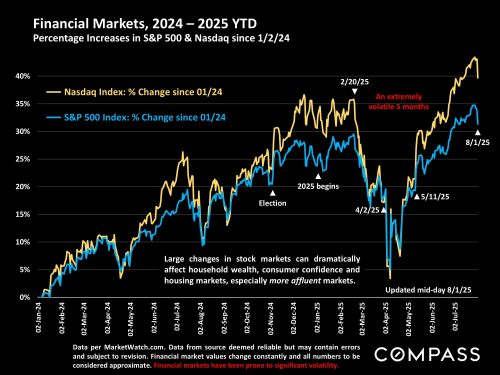
New tariff policies were just announced by President Trump, affecting both stock markets and interest rates today.
As of mid-day 8/1/25, stock markets had seen significant declines (though trading is volatile and extremely hard to predict). A better idea of where stock markets are heading will probably become apparent early next week. And, of course, tariff policy can change quickly and dramatically.
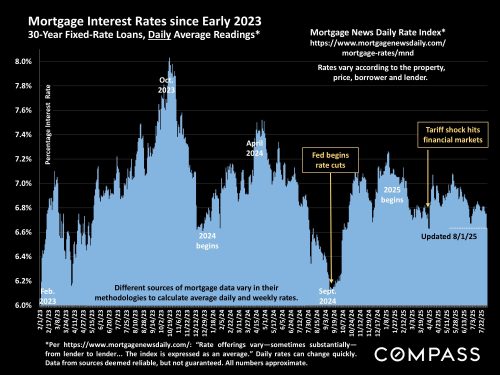
Interest rates dropped today by their greatest amount since early April – 12 basis points per Mortgage News Daily.
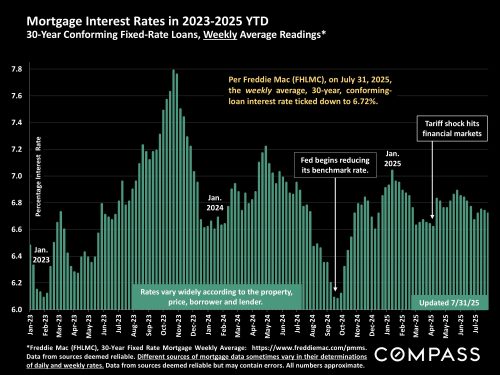
Freddie Mac chart’s weekly average was updated yesterday, and does not reflect today’s change:
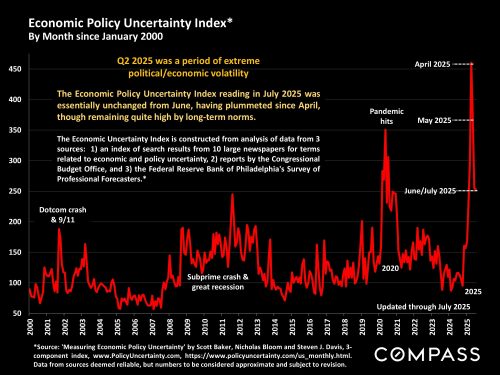
The July 2025 Economic Policy Uncertainty Index, released this morning, was essentially unchanged from June’s reading: It plummeted from April’s extreme peak, but remains very high by long-term norms.
Consumer Sentiment (Confidence), 8/1/25 release: “Consumer sentiment improved for the second straight month, inching up a scant single index point from June. Current conditions rose about 5% to its highest reading since February 2025, while the expectations index fell slightly. A rise in sentiment among stockholders was partially offset by a decline among consumers who do not own stocks. Perceptions of this month’s economic developments were similar across the political spectrum…all saw some minor increases in sentiment this month. Although recent trends show sentiment moving in a favorable direction, sentiment remains broadly negative. Consumers are hardly optimistic about the trajectory of the economy, even as their worries have softened since April 2025….Year-ahead inflation expectations fell for a second straight month, plunging from 5.0% last month to 4.5% this month.” University of Michigan Surveys of Consumers, 8/1/25
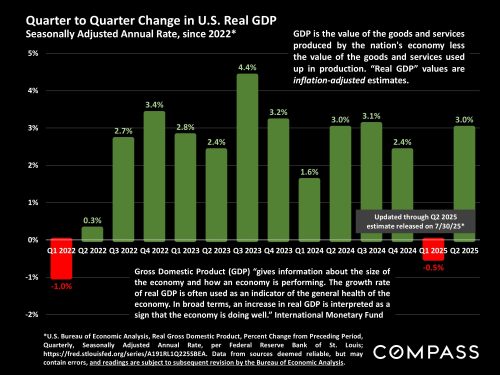
GDP rebounded in Q2 from the Q1 decline, though many economists believe the change was distorted by the tariff policy issues in Q2.
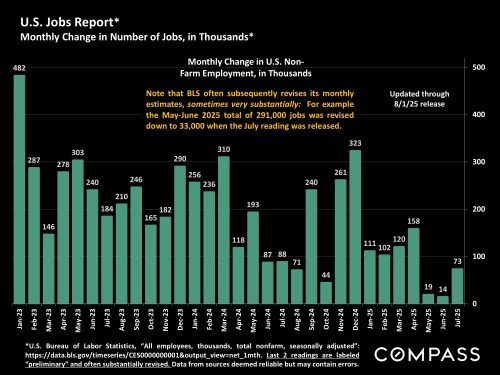
The July jobs report was released today, 8/1/25, but new monthly readings are “preliminary,” and often very substantially revised later – but investors take them very seriously to a large degree due to their beliefs on possible impacts on the Fed: Poor jobs reports are expected to make Fed benchmark rate reductions more likely (which investors like). The May and June 2025 readings of 144,000 and 147,000 new jobs were revised in the latest release today to 19,000 and 14,000 jobs, a stupendous change. Which makes one question how accurate the new July reading is. The net point is that during the last 2 months of Q2, job creation was extremely low, much lower than previously thought.
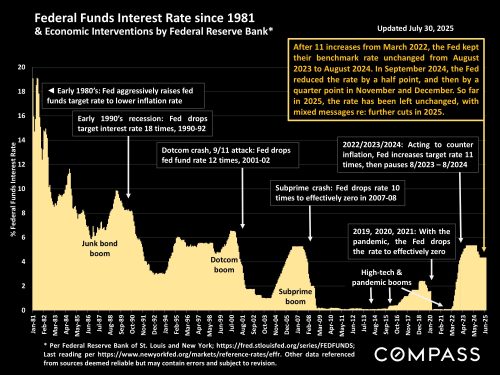
The Fed left their benchmark rate unchanged again in July, though, for the first time in decades, 2 board members dissented, saying they believed a small rate reduction was warranted. Many analysts believe a reduction of some degree will be coming soon – especially with today’s jobs report – but much depends on the next inflation reading on 8/12/25.
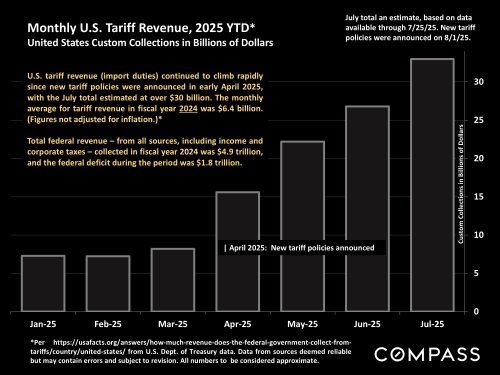
A look at the recent changes in tariff revenues proceeding from the new tariff policies announced in April: The July total is estimated based on data through 7/25/25. From 2021 through 2024, the monthly average for tariff revenue ranged in the $6 billion to $8 billion per month range. The July 2025 total is estimated to be over $30 billion.
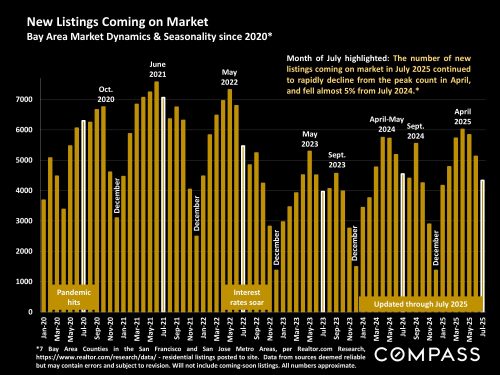
Preliminary Bay Area market data for July was just released:
As is the typical seasonal trend, the number of new listings continued to quickly decline after hitting its high in spring – and the number also fell year over year.
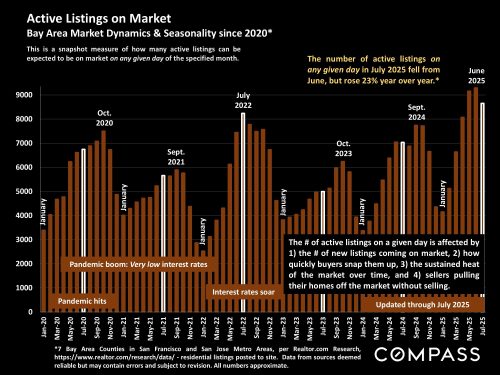
Active listings on a given day of the month declined from the June peak, but are up 23% year over year
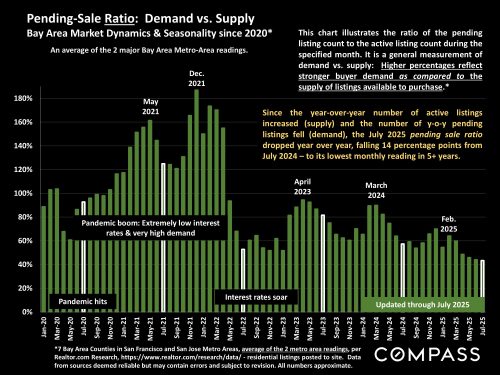
The pending-sale ratio continued to decline month over month (very slightly) and year over year (more significantly) since the increase in listings outpaced any positive change in demand, i.e. listings going into contract:
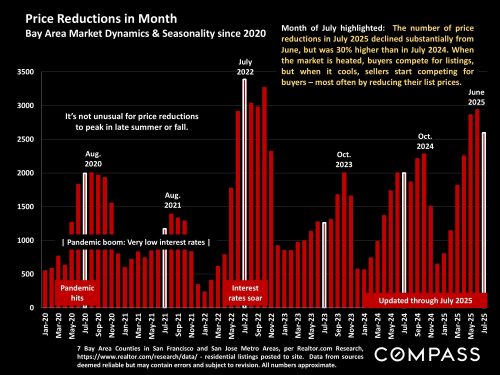
According to the source of this data, the number of price reductions declined from June, but was the highest month-of-July reading since 2022 (after interest rates soared).
Inflation ticked up in what most economists saw as an indication that the impact of new tariff policies were beginning to show up in prices. There are wide disagreements – between analysts, investors, economists, high officials in government – as to what will occur with inflation in the 2nd half of 2025.
The Fed continues to refuse to lower their benchmark rate despite enormous political pressure to do so. They cite the strong economy and the potential for inflation to increase. Expectations regarding the timing and size of future cuts fluctuate constantly.
In recent months, interest rates have been ticking up and down (and up) within a relatively narrow band of values: Below are conforming-loan and jumbo rate charts.
The Consumer Sentiment (Confidence) index ticked up slightly in today’s release, but remains very low by long-term standards: “Consumer sentiment was little changed from June [and]…while sentiment reached its highest value in five months, it remains… well below its historical average… Consumers are unlikely to regain their confidence in the economy unless they feel assured that inflation is unlikely to worsen…At this time, [there is] little evidence that other policy developments, including the recent passage of the tax and spending bill, moved the needle much on consumer sentiment. Year-ahead inflation expectations fell for a second straight month, plunging from 5.0% last month to 4.4% this month…the lowest since February…[But indications are] that consumers still perceive substantial risk that inflation will increase in the future.” University of Michigan Surveys of Consumers, Director Joanne Hsu, 7/18/25
Stock markets hit new all-time highs.
An overview of Bay Area County (and Sacramento) median house sales prices in Q2, and year-over-year appreciation rates.
Cities & towns with largest population gains through mid-July 2024: These gains in the last year measured were enormously impacted by immigration into the country, which is now, with changes in federal policy, apparently shifting into reverse. This may have significant ramifications for Bay Area markets, since Bay Area population and housing demand have been enormously affected by immigration. Of course, deportation efforts are focused on illegal immigrants – who don’t play a huge role in our housing markets (beyond their impact on home construction), but anti-immigration and tariff policies may dramatically affect the immigration of those who have previously flocked here for high-paying high-tech jobs and opportunity, and who have played a big role in buyer demand.
The latest look at where housing construction is concentrated in the U.S.: Some of these regions – Florida and Texas are often mentioned – have reportedly seen a greater softening in their housing markets in 2025 due to an oversupply of new homes on the market. (There are other issues, such as insurance availability and costs, also at play in those regions, as well as in CA.)
Stock markets & volatility: Stock markets plunged today – continuing the huge decline from late February – and volatility soared in response to the president’s announcement regarding tariffs.
Interest rates fell to their lowest reading since last October as investors jumped out of the stock market and into bonds.
Some new Bay Area supply and demand data points were released today. They are generally similar to new national trends data pertaining to new and active listings, and price reductions.
Of course, there are variations between markets. Specific regional Bay Area market reports should be finished and posted by early next week.
Note that many, if not most, of the sales closing in March (as referenced in the below charts) reflect market conditions in February when the offers to purchase went into contract, and thus pre-date the enormous changes in consumer confidence and stock markets that occurred in March (and early April). April sales data will probably better reflect the economic changes that occurred last month.
Preliminary sales data for luxury home sales of $5 million+ in March 2025: I expect a few more sales for March will be reported in coming days, but as of 4/2/25, 104 $5m+ sales were reported, an 82% month-over-month jump from February (57 sales), and a 65% year-over-year increase from March 2024 (63 sales), and about the same number of sales that occurred in March 2022, when the market was peaking in the last months of the pandemic boom.
New listings: Using the San Francisco & San Jose Metro Areas (7 counties) as a large sample size for the greater Bay Area, the number of new listings in February rose 27.5% year over year and was the highest month-of-February count since the end of the pandemic boom. The “mortgage lock-in effect” appears to be quickly weakening. (Nationally, the percentage year-over-year increase was 4% – the spring market begins earlier in the Bay Area. The percentage in Sacramento County was +15%.)
Active/Coming-Soon listings on 3/1/25: For the greater Bay Area, the count of listings on the market in MLS was up approximately 42% year over year, and was by far the highest March 1st count in at least 4 years. Note that this will not include hundreds of Compass Exclusives – or other brokers’ exclusive off-MLS listings – that might have added to the count in previous years. Looking at individual markets, San Francisco’s 3/1/25 count of active/coming-soon was barely higher year over year and relatively unchanged over the past 4 years. Tri-Valley & South Alameda County’s count was 89% higher year over year; Lamorinda (a small market) was 84% higher; Santa Cruz County was +70%; both Napa & Sonoma, +64%; North Contra Costa, +53%; Marin, +49%; Santa Clara County, +48%; Diablo Valley, +41%; Inner East Bay, +36%; San Mateo, +31%; Monterey County, +26%; Stanford Circle, +13%.
If the number of active/c-s listings was particularly low last year – for example, in the Tri-Valley & South Alameda County market – then percentage rebounds will often be outsized.
Price reductions (using the SF and San Jose metro areas as large Bay Area samples): The early months of the year are typically not big months for price reductions, but the number of price reductions in February 2025 was 55% higher than in February 2024, and was the highest month-of-February count in at least 6 years. We will see how this trend develops in coming months. (Nationally, price reductions were up 30% year over year. In Sacramento County, reductions rose 83%.)
Of course, if inventory increases, it will be one factor in the increase in price reductions.
Initial calculations regarding January’s Bay Area new-listings numbers reflect a huge rebound from December (as is typical) and a large jump over January 2024.
Weekly average interest rate: relatively steady at just under 7%
The Fed left its benchmark rate unchanged at its 1/29/25 meeting. Expect to see a struggle between the new administration and the Fed regarding the benchmark rate in coming months. The next CPI (inflation) reading comes out on 2/12.
Q4 GDP change was just released: Came in slightly weaker than expected by most economists (but these quarterly numbers are often significantly revised – as the Q3 number has been since its initial release)
Consumer confidence dropped slightly in the January reading, reflecting some uncertainty as to where the economy is heading.
Stock markets have been rebounding from their “DeepSeek” plunge a few days back.
Another angle on Bay Area + Sacramento median house price changes over the long-term: All markets up from 2023, some hitting new price peaks. (See January newsletters for individual county/regional charts.)
The latest numbers and map, through 2024, regarding billion-dollar+ weather-related disasters and state insurance rates.
Though climbing rapidly in recent years, analysts believe CA insurance costs have been held down unnaturally low due to state insurance regulations, which are now being rapidly revised to try to stop insurers from completely fleeing the state (and continuing to shift enormous financial liabilities to the state Fair Plan). Needless to say, the horrifying fires in SoCal will only exacerbate the critical situation regarding insurance. The rates in this chart are changing quickly and substantially.
The number of new listings coming on market in 2024 rose from 2023, but remained low by historical standards, a common Bay Area county dynamic. Older homeowners who move (much) less often, and the mortgage lock-in effect remain significant factors.
Overall sales rebounded from the 2023 nadir, but remained far below longer-term averages: This trend was very common across Bay Area Counties. In the country as a whole, according to NAR, existing-home sales ticked down very slightly in 2024.
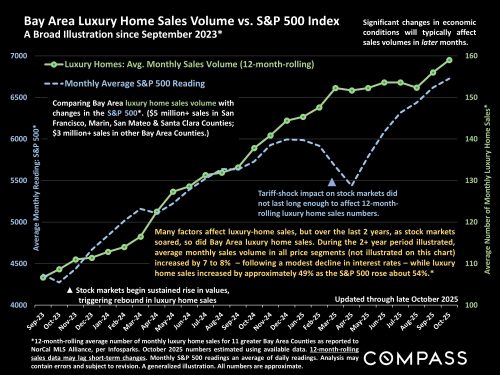
Luxury home sales rebounded much more dramatically than the overall market, hitting its second highest number in history. Soaring stock markets, especially in those counties where the AI boom was centered in 2024, were very big factors. Affluent buyers, buoyed by increases in their household wealth and rising home equity, jumped back in the market more than the general buyer – and affluent buyers were most likely able to pay all-cash, and thus not as concerned about interest rates.
2024 median house sales prices by county: Several counties hit new all-time highs, while others remain below the peaks hit in 2021 or 2022.
5-year appreciation rates illustrate how the big changes occurring since 2019 – pandemic, demographic shifts, inflation, interest rates, stock markets – impacted appreciation rates dramatically between counties. Santa Clara saw the highest appreciation rate, being the center of 2024’s enormous AI boom, but other counties were close behind. (The AI boom took a substantial hit today in stock markets, but it is far too early to come to any conclusions as to its future.) San Francisco saw the lowest 5-year appreciation rate, generally due to pandemic-fallout issues, which now appear to be fading. The full report includes 2024 year-over-year appreciation rates (from 2023) as well as the 5-year analysis below.
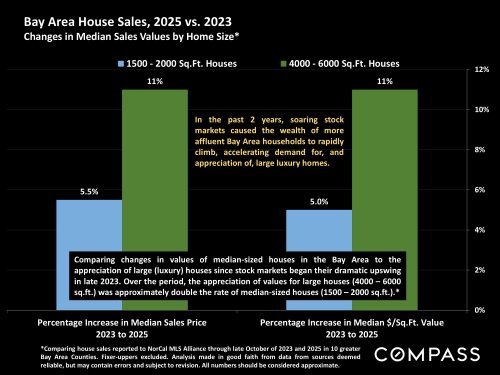
Remember that if affluent buyers become a larger component in the market, as occurred in 2024, that will help pull up median sales prices simply because they buy more expensive houses.
Median house sales price by county since 2011:
Median 2-bedroom condo sales prices in 2024. San Francisco has by far the largest condo market as a percentage of sales in the Bay Area, and the most substantial luxury condo market – especially of high-rise luxury condos – and this is reflected in its higher median sales price.
Looking at the last 5 years, San Francisco condo prices were negatively affected by demographic shifts triggered by the pandemic, such as work from home, population decline, and (well publicized) social issues in the downtown area of the city. However, the median SF condo sales price did tick up in 2024 over 2023 (not illustrated in the chart below), suggesting it is beginning to recover.