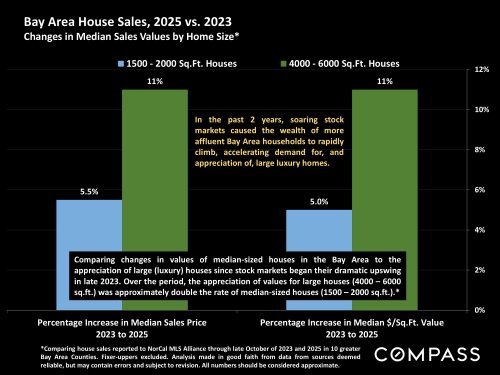
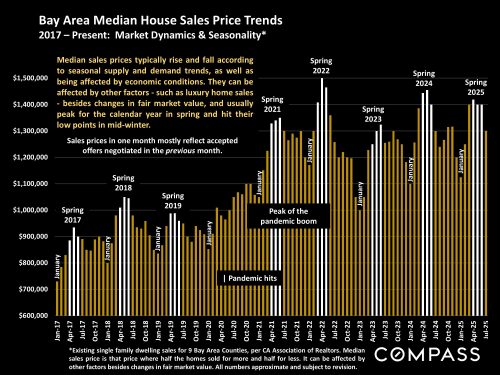
A year-over-year look at total 1st half sales for 11 greater Bay Area Counties. In Q1 2025, both dollar volume and unit sales volume increased from Q1 2024. Then in Q2, with the enormous economic volatility, dollar-volume and unit sales volume declined year over year, though not by huge percentages (down 2.5% in dollars, 3.4% in units). Overall, 1st half sales in 2025 increased about 2.4% by dollar volume sales. Note that, as always, trends varied by county.

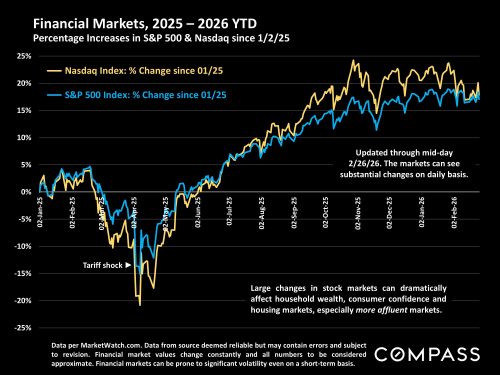
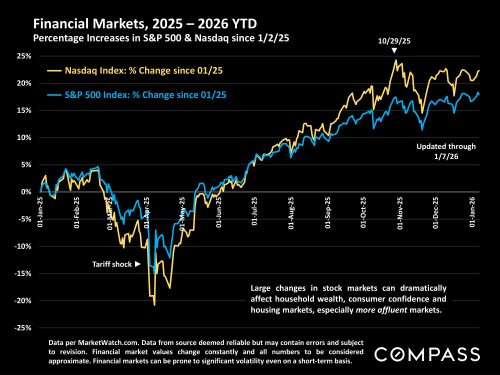
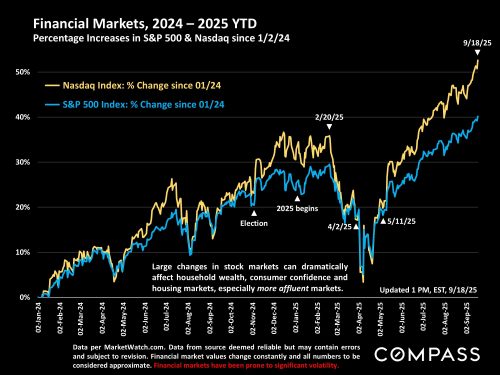
New tariff policies were just announced by President Trump, affecting both stock markets and interest rates today.
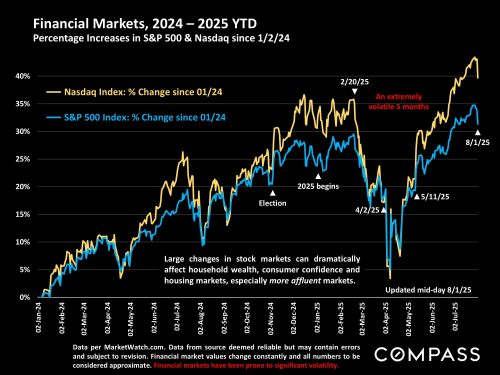
As of mid-day 8/1/25, stock markets had seen significant declines (though trading is volatile and extremely hard to predict). A better idea of where stock markets are heading will probably become apparent early next week. And, of course, tariff policy can change quickly and dramatically.
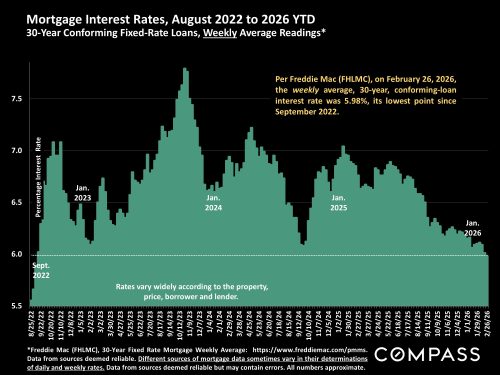
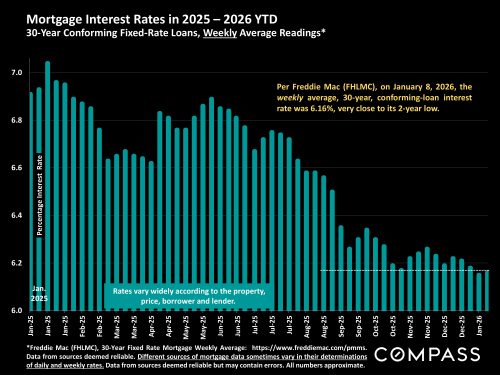
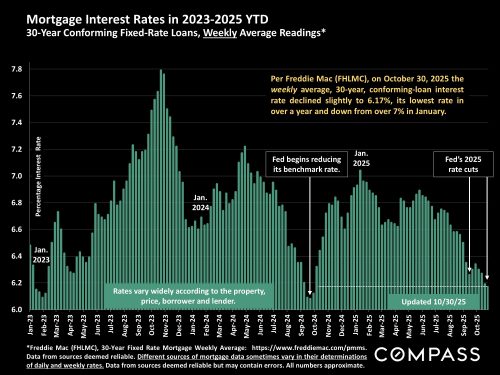
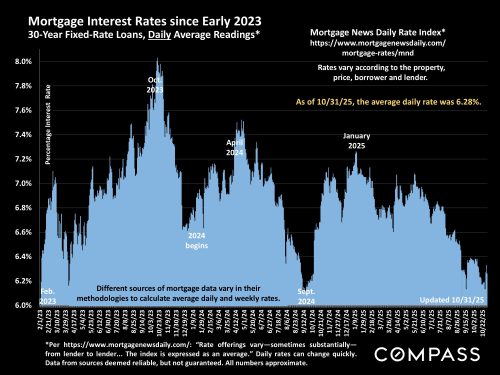
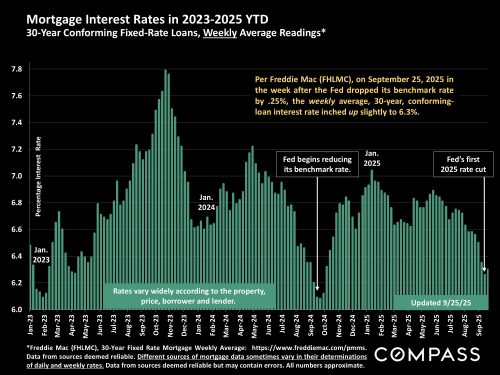
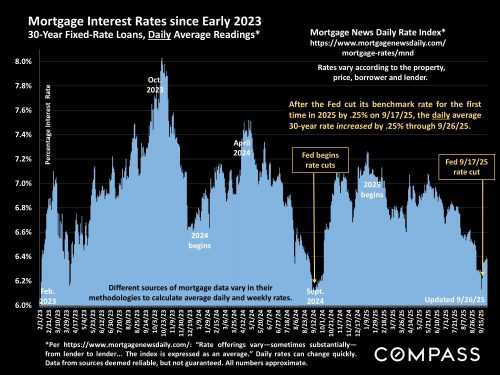
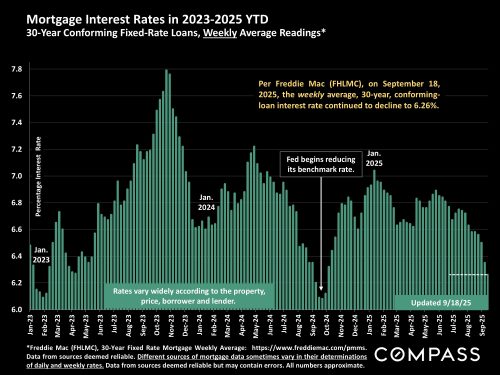
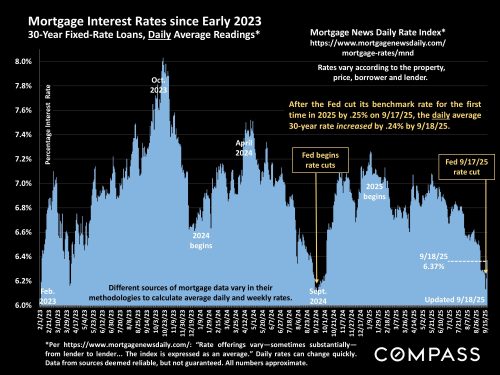
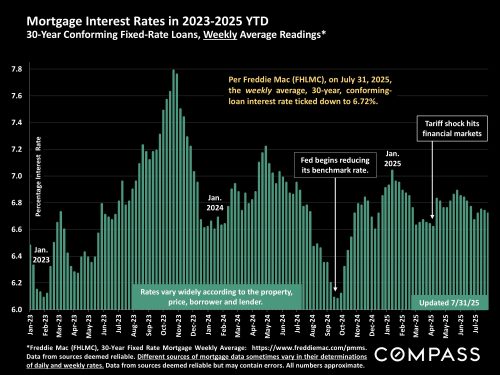
Interest rates dropped today by their greatest amount since early April – 12 basis points per Mortgage News Daily.
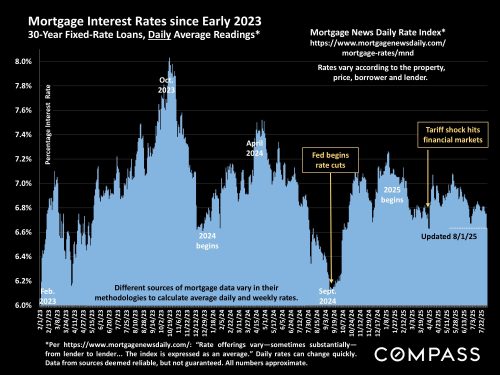
Freddie Mac chart’s weekly average was updated yesterday, and does not reflect today’s change:
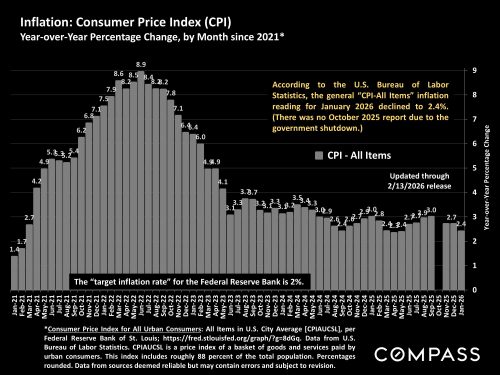
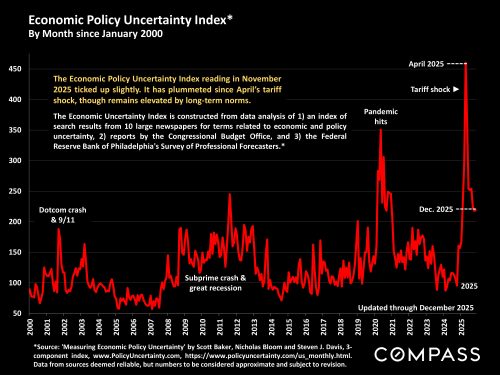
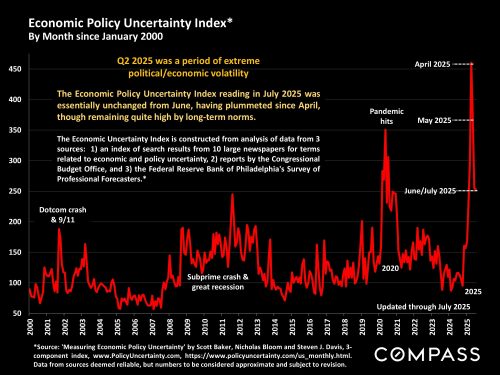
The July 2025 Economic Policy Uncertainty Index, released this morning, was essentially unchanged from June’s reading: It plummeted from April’s extreme peak, but remains very high by long-term norms.
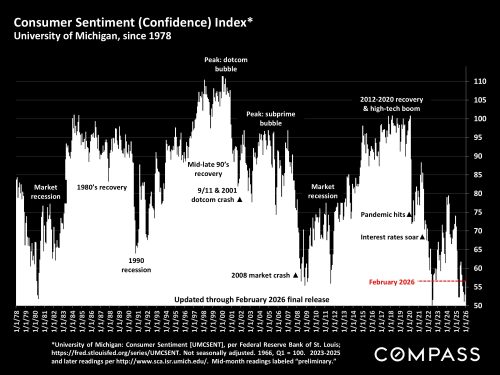
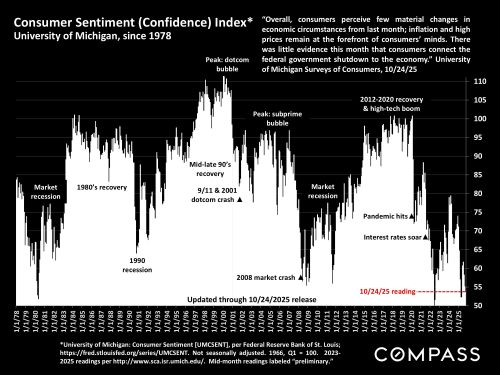
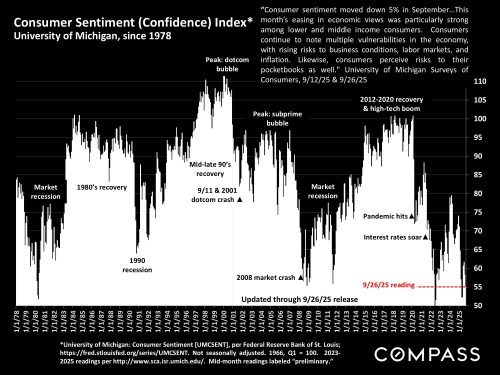
Consumer Sentiment (Confidence), 8/1/25 release: “Consumer sentiment improved for the second straight month, inching up a scant single index point from June. Current conditions rose about 5% to its highest reading since February 2025, while the expectations index fell slightly. A rise in sentiment among stockholders was partially offset by a decline among consumers who do not own stocks. Perceptions of this month’s economic developments were similar across the political spectrum…all saw some minor increases in sentiment this month. Although recent trends show sentiment moving in a favorable direction, sentiment remains broadly negative. Consumers are hardly optimistic about the trajectory of the economy, even as their worries have softened since April 2025….Year-ahead inflation expectations fell for a second straight month, plunging from 5.0% last month to 4.5% this month.” University of Michigan Surveys of Consumers, 8/1/25
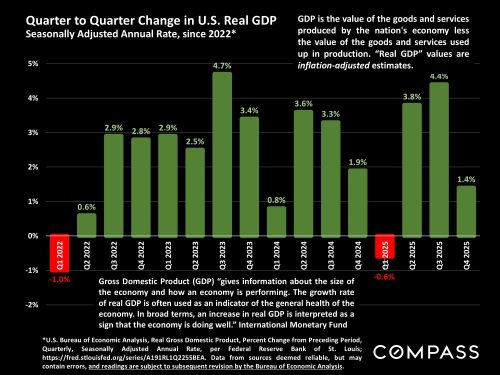
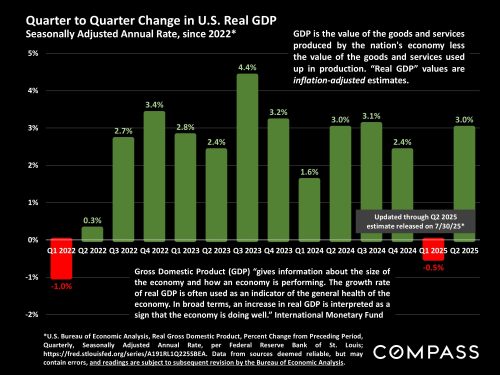
GDP rebounded in Q2 from the Q1 decline, though many economists believe the change was distorted by the tariff policy issues in Q2.
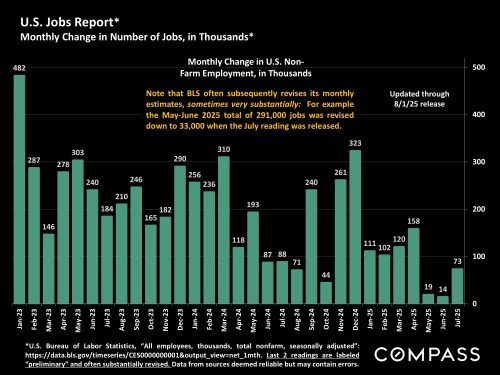
The July jobs report was released today, 8/1/25, but new monthly readings are “preliminary,” and often very substantially revised later – but investors take them very seriously to a large degree due to their beliefs on possible impacts on the Fed: Poor jobs reports are expected to make Fed benchmark rate reductions more likely (which investors like). The May and June 2025 readings of 144,000 and 147,000 new jobs were revised in the latest release today to 19,000 and 14,000 jobs, a stupendous change. Which makes one question how accurate the new July reading is. The net point is that during the last 2 months of Q2, job creation was extremely low, much lower than previously thought.
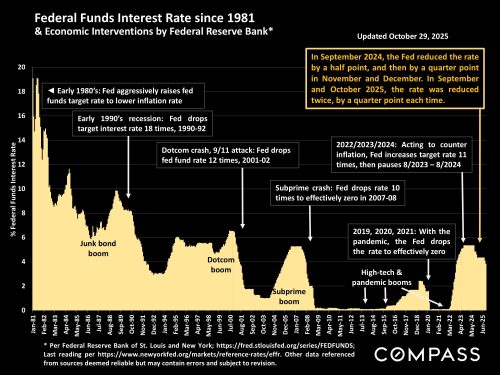
The Fed left their benchmark rate unchanged again in July, though, for the first time in decades, 2 board members dissented, saying they believed a small rate reduction was warranted. Many analysts believe a reduction of some degree will be coming soon – especially with today’s jobs report – but much depends on the next inflation reading on 8/12/25.

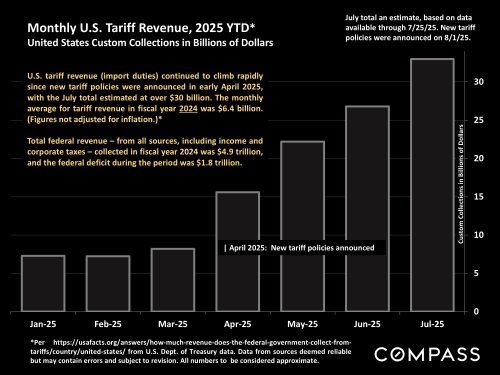
A look at the recent changes in tariff revenues proceeding from the new tariff policies announced in April: The July total is estimated based on data through 7/25/25. From 2021 through 2024, the monthly average for tariff revenue ranged in the $6 billion to $8 billion per month range. The July 2025 total is estimated to be over $30 billion.
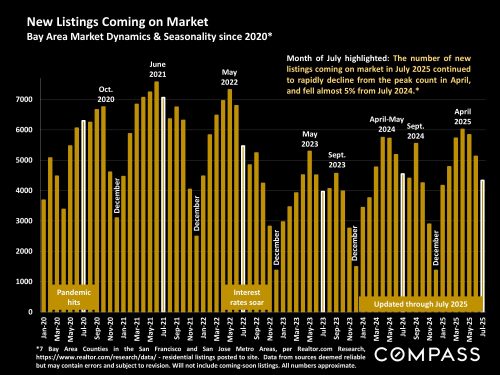
Preliminary Bay Area market data for July was just released:
As is the typical seasonal trend, the number of new listings continued to quickly decline after hitting its high in spring – and the number also fell year over year.
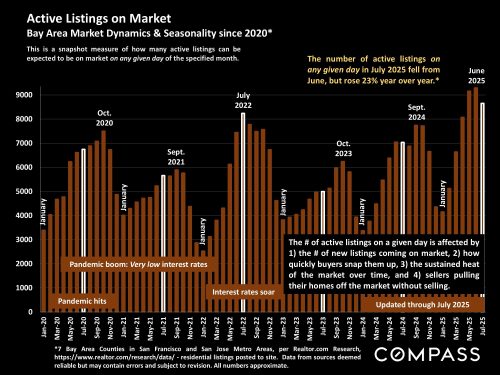
Active listings on a given day of the month declined from the June peak, but are up 23% year over year
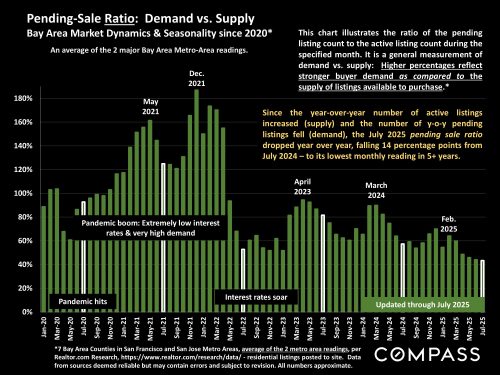
The pending-sale ratio continued to decline month over month (very slightly) and year over year (more significantly) since the increase in listings outpaced any positive change in demand, i.e. listings going into contract:
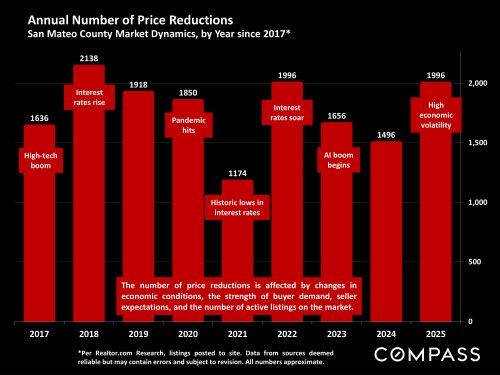
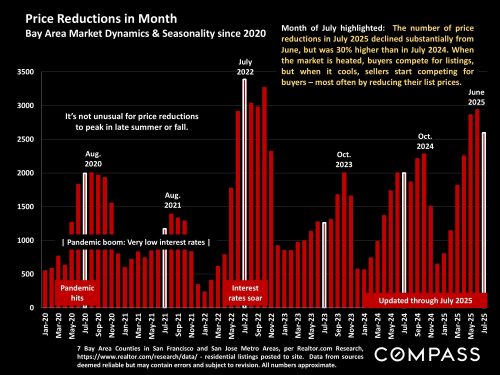
According to the source of this data, the number of price reductions declined from June, but was the highest month-of-July reading since 2022 (after interest rates soared).
 January 1, 2026
  Market Update, November 1, 2025
  Just Listed in Old Palo Alto
  Just Listed in Portola Valley